

If you are making real estate decisions based on the broad analysis of the Great Recession they’re going to be flawed. It’s been eleven years since the “real estate bubble” popped. Yet we still hear people from mainstream media talking-heads to ‘the man on the street’ using the credit-asset driven real estate bubble as a reference for what the housing market is doing today. But today’s market is dramatically different than in 2008.
For example, the recent refrain from various media sources that “prices are near the peak” of the last cycle (late 2006.) In some parts of the country it may appear at first glance that housing prices have moved past those previous highs. When you only do a surface level analysis you end up with a graph that looks like the main image for this post.
But is this analysis reality or is it just a lazy surface-level observation that if used as guidance could put you off the mark on your decisions related to real estate? Setting aside for a moment that all real estate is local, let’s take a look at a major factor impacting housing prices that most so-called experts ignore.
Real Housing Prices
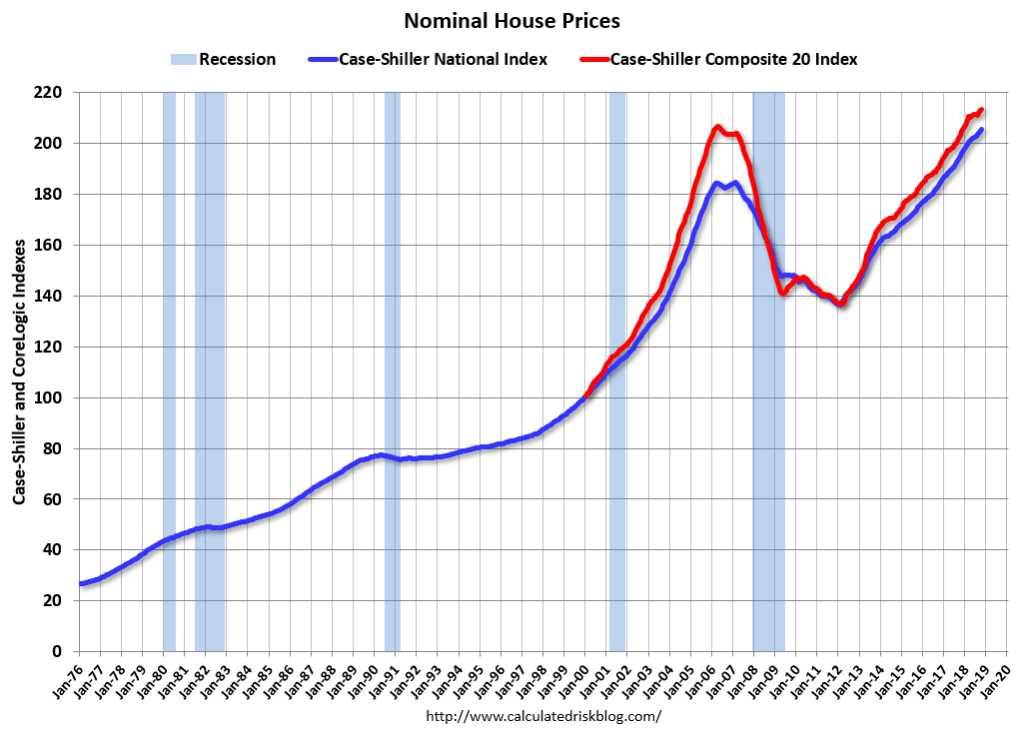
Misleading statements like “prices are near the 2006 peak” are made based on misperceptions caused by looking at only nominal housing prices. Case-Shiller and others only report nominal house prices so hence that’s what most people normally graph. Here’s what nominal prices look like.
 But this is flawed if you don’t also look at real housing prices, which means using inflation-adjusted numbers. No one has done a better job at helping explain real housing prices than Bill McBride over at Calculated Risk.
For example as you can see in the image above Bill shows graphically how the seasonally adjusted National Index (SA), was reported in the final Case-Shiller release of 2018 as being 11.4% above the previous bubble peak. But in real terms the National index (SA) is still about 8.9% below the bubble peak as shown in the graph below.
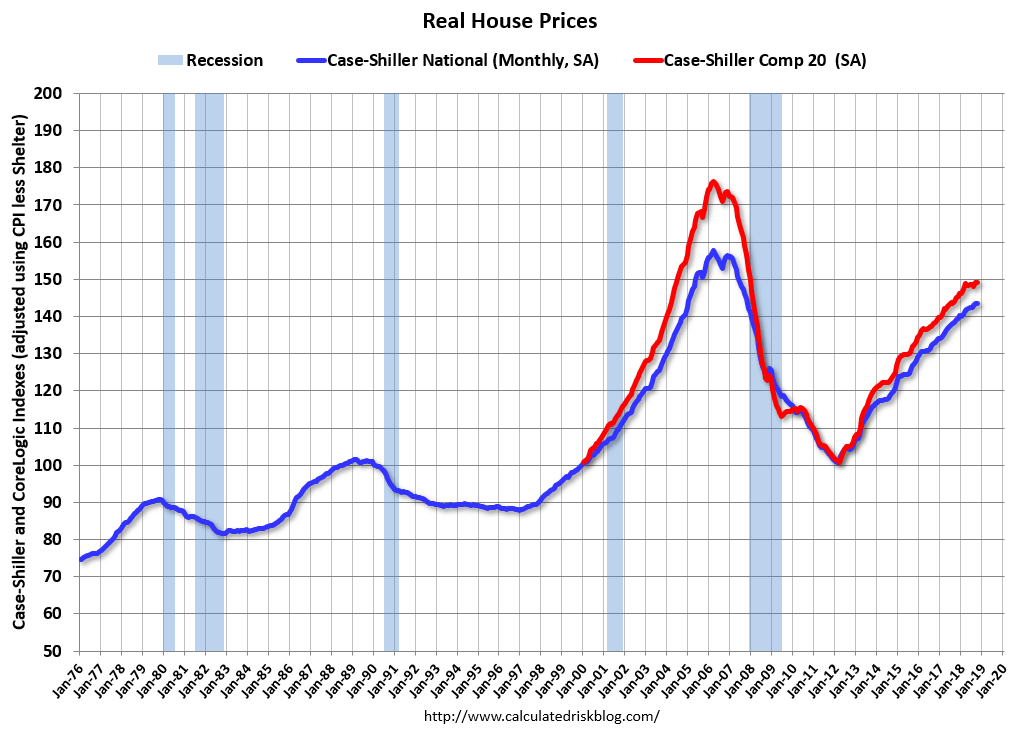
Quite the difference, right? And you gain additional clarity when you overlay a line at the peaks. That clearly overly will reveal the historical upward slope to real house prices, so in reality the Composite 20 is still 12.4% below the bubble peak.
So what causes this disparity between nominal and real housing prices?
In one word; inflation. It’s important to consider when looking at any historical financial data. But it’s critical when you understand that the Federal Reserve has printed (pumped into the market) more than $4-trillion between 2008-2014.
Here’s a simple example of what impact flooding the economy with those dollars has on real home prices.
A house that sold for $200,000 in January 2000 would have a sale price of close to $286,000 today adjusted for inflation (43%). That means in real terms, prices are back to late 2004 levels. That is WITHOUT factoring in housing appreciation in local markets due to factors such as demographic shifts, business growth or limited of supply.
All real estate needs to be analyzed based on local conditions, but in a general sense when you look at the historical slope of home prices you see that real housing prices are in-line with historical data.
So are housing prices really too high?
Keeping in mind that all real estate is local, to answer this question you need to consider three primary components that broadly affect housing prices; local demographic shifts, credit access, and the national economy — then relate all three to real housing prices.
Demographic shifts (people moving into or out of a State or locality) obviously needs to be researched based on where you live. You must carefully analyze the positive or negative pressure that demographic shifts have on your local market. This is a key player in putting demand pressure on housing prices.
The US economy and stock market are always in flux, especially now being tied to a global economy. However when it comes to the financial underwriting of residential real estate, for now we know that is solid. Today’s credit climate is dramatically different than the one leading to the 2008 crash.
There were many factors that combined and lead to the real estate bubble popping. One thing that’s clear is that mortgages were handed out freely with no-doc loans and a host of other questionable lending twists. This allowed mom & pop speculators and unqualified homebuyers to get quickly and easily get mortgages. Today qualifying for a mortgage is more stressful than a trip to the Proctologist. And though mortgage rates have been creeping up, they are still far below the historical average of 6.5%.
Putting it all together for a more accurate analysis
Now when you factor into your analysis real housing prices for your local market you have an accurate picture. Considering the underlying strength of financing and real housing demand in specific local markets today’s economic threat is not an overheated real estate market. Now college loan debt, that’s a whole other story.
Check out all the graphs and read more at Calculated Risk.
Disclaimer: The Information & content in this message is solely the opinion of the author and believed to be from reliable sources. Charts and tables contained herein were taken from other sources and a best effort was attempted by the author to give attribution where possible. None of this material should be construed as fact, and is not intended for use by reader as investment advice or relied upon for making financial decisions.